Why Should I Consider Technical Analysis?
For questions like “What to buy?” requires fundamental analysis. But when someone asks, “When to buy?” This is when technical analysis comes into play. Technical analysis is the other approach of investing. When you talk about technical analysis, you’re looking at things like charts, chart patterns, technical indicators, etc. It gives you a visual information about how the stock price moves for the minute, the hour, the day, week and even month! This information is useful because it can give you a better sense of how the stock is doing right at the moment. Fundamental analysts usually have to deal with information that isn’t updated because company reports would only come out quarterly, or even annually! Many things happen in between the quarters but you could possibly be trading based on the previous quarter’s results which may no longer be relevant.
Pure technical analysts are not interested in the research of a company’s fundamentals because the way a stock price moves would have indicated how much everyone thinks the stock is generally worth. When an undervalued stock moves because it was uncovered by a fundamental analyst, it wouldn’t be missed by technical analyst who watch price-volume action of a share price. As long as a stock moves, the technical analysts will be there watching it as well! Price movements can give a technical analyst a lot of information such as breakouts, psychology of the market players, trend, reversal patterns, etc. These days, there are a lot of people relying on charts when buying a stock. You would only be putting yourself in a disadvantaged position if you choose not to avail yourself to the same information they are receiving. With more and more speculators in the market, fundamentals might be ignored for short moments and only technical analysis can help you for the moment to be profitable.
Here’s an example:
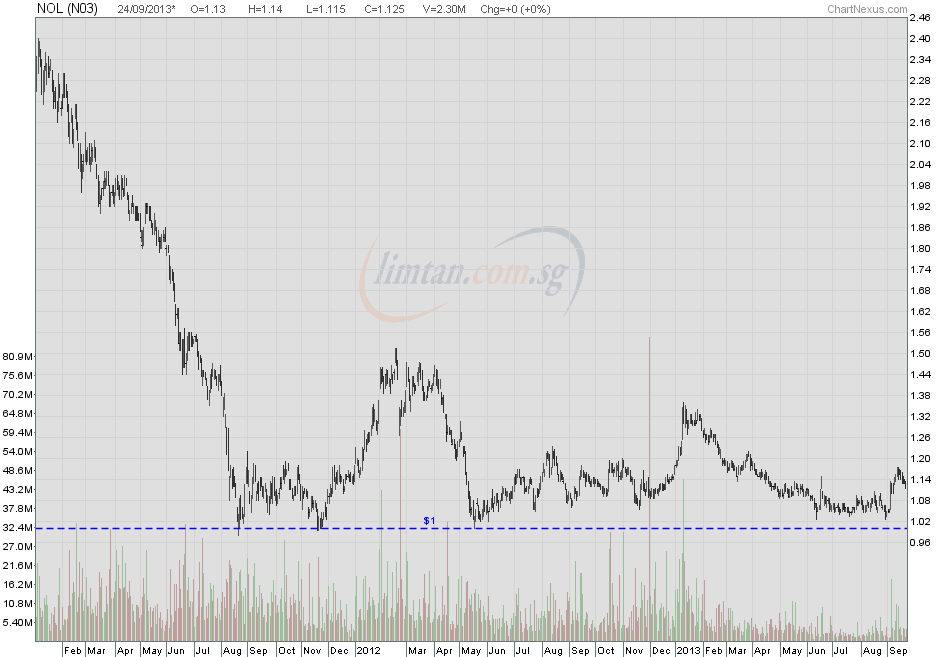
A pure fundamental analyst would not know where the support or the resistance is. He would know what the company should be valued at but he may not know when is the best time to enter. For example, NOL is down-trending from $2.30. A fundamental analyst values it at $1.50 based on Price-Book ratio, P/E ratio, or other metrics available to him. When NOL sells down to $1.50, the fundamental analyst would make the purchase because he thinks that is what it is worth. However, from a technical analyst point of view, he would wait to see if $1.50 is supported or not. If the price is not supported, he waits for the share price to continue falling and test the next support level at $1. When share price eventually gets to $1 and shows that it is supported with a high volume, the technical analyst buys it.
At the end of the day, both analysts got NOL, but the technical analyst got a better price because he knows that from past price movements that $1 is a strong psychological support and buys it at a support instead of simply buying it because he thinks that is what it is worth. Past price actions can give you a hint about the future price movement because of many reasons, largely psychological support and resistance levels. The fact is that many people are relying on such information, and if you aren’t, you will lose out and the market will not make sense to you. Having a visual image of how the stock market is going will be very much easier for you to find support levels such as in the case above.
Of course, this is not to say that technical analysis is 100% accurate and gives you pin-point accuracy. What it can provide you is more information that opens up your eyes to more opportunities for buying entries. There is always a time an investor will face where he says “I’m waiting for the right time to enter”. It could be a fundamentally sound company but simply trading too expensively and this is when technical analysis will tell you when the right time is. Or rather, give you a hint of when the right time is. Of course, hindsight is 20/20 and the chart above could have gone in a totally different direction and crashed through $1 rather than stay supported on 2 more counts on Nov 2011 and May 2012. I used an old chart for the purpose of effectively sending my point across rather than try to teach based on current prices where even I don’t know where the future is. No one can predict how the future price will move, they can only get a vague idea of it. By effectively utilising both fundamental and technical analysis, you would put yourself in a profitable position where the odds of a profitable trade is higher.
Important Disclaimer
The above chart is for teaching purposes only and is not a recommendation to buy/sell.


